The origin of the ATR indicator
The Average True Range (ATR) is a technical indicator that measures the volatility of a financial instrument.
It was developed by J. Welles Wilder Jr. in the 1970s and has since become a popular tool among traders in various financial markets, including Forex and the stock market.
What the ATR indicator shows
The ATR is calculated by taking the average of the true range over a specified number of periods. The true range is the greatest of the following:
The current high minus the current low
The absolute value of the current high minus the previous close
The absolute value of the current low minus the previous close
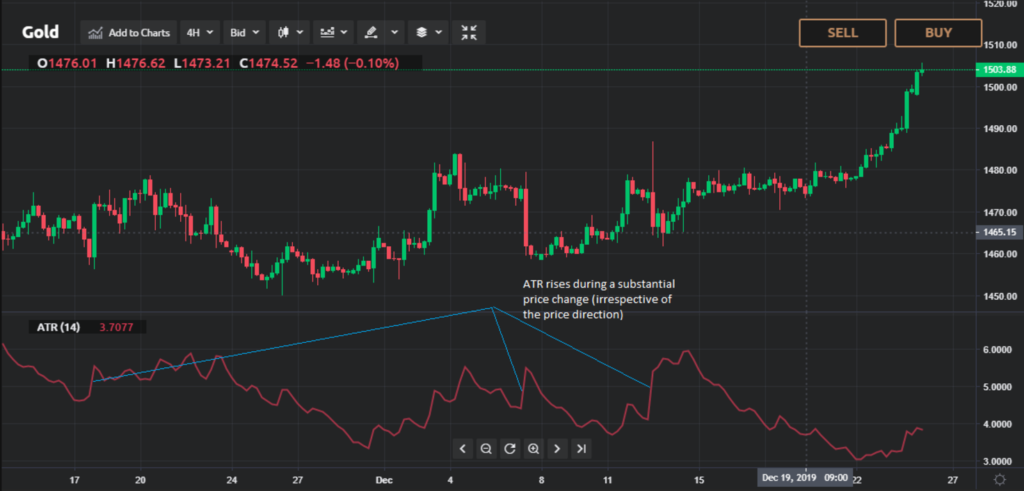
The ATR is typically presented as a single line on a chart, with the vertical axis representing the ATR value and the horizontal axis representing time. A higher ATR value indicates a higher level of volatility, while a lower ATR value indicates a lower level of volatility.
How the ATR indicator can help you in your trading
One of the main uses of the ATR is to identify periods of high and low volatility in the market. During periods of high volatility, the ATR will be relatively high, indicating that the price of the financial instrument is fluctuating significantly.
Conversely, during periods of low volatility, the ATR will be relatively low, indicating that the price of the financial instrument is not fluctuating as much.
ATR for setting TP and SL levels
Traders can use the ATR to set appropriate stop-loss and take-profit levels in their trades. For example, if the ATR is relatively high, a trader may set wider stop-loss and take-profit levels to account for the increased volatility.
On the other hand, if the ATR is relatively low, a trader may set narrower stop-loss and take-profit levels, as the price is less likely to fluctuate significantly.
ATR used for entry and exit points
In addition to setting appropriate stop-loss and take-profit levels, traders can also use the ATR to identify potential entry and exit points in the market.
For instance, if the ATR is relatively high, it may be a good time to enter a trade, as there is likely to be increased price movement that the trader can capitalize on.
On the other hand, if the ATR is relatively low, it may be a good time to exit a trade, as the price is less likely to fluctuate significantly.
Another way that traders can use the ATR is to confirm trends in the market. If the ATR is consistently increasing, it may be an indication that the current trend is strong and likely to continue.
Conversely, if the ATR is consistently decreasing, it may be an indication that the current trend is losing strength and may be coming to an end.
ATR indicator best practices
It’s worth noting that the ATR is not a standalone indicator and should be used in conjunction with other technical and fundamental analysis tools.
For example, a trader may use the ATR in conjunction with trend indicators such as moving averages or oscillators like the Relative Strength Index (RSI) to get a more complete picture of the market.
In summary, the Average True Range (ATR) is a technical indicator that measures the volatility of a financial instrument.
It is used by traders to set appropriate stop-loss and take-profit levels, identify potential entry and exit points in the market, and confirm trends. While the ATR is a useful tool, it should not be used in isolation and should be combined with other analysis techniques for a more comprehensive approach to trading.